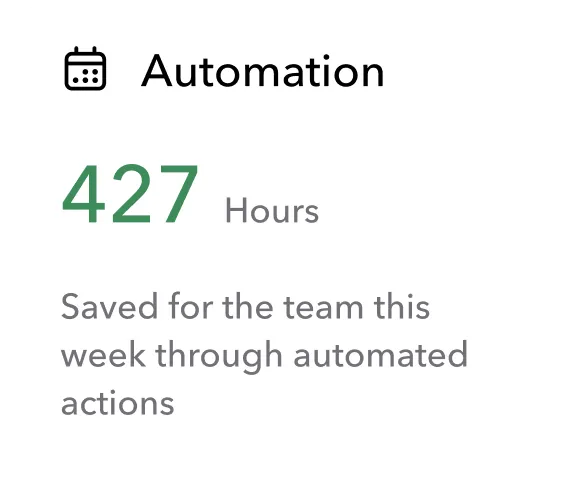
Gut-feel scheduling bleeds margin and burns out crews. Predictive labor forecasting replaces guesswork with demand signals, AI, and intraday coverage that actually holds.
Related demo
See scheduling workflows in Teambridge
Try our workforce AI agents, then book time to map the workflow to your operation.
Most operations leaders will admit it quietly: the schedule for next week looks a lot like the schedule from last week, with a couple of names swapped in. That is gut-feel scheduling dressed up in a spreadsheet. It worked when demand was steady and labor was cheap. Neither is true anymore.
Predictive labor forecasting is the move away from rear-view planning. Instead of staffing to a static template, you staff to a demand curve built from live signals — POS, foot traffic, weather, event calendars, callout history — and let the system adjust before the shift goes sideways. This article is for operators who are tired of choosing between padded payroll and missed coverage.
The True Cost of Guessing: Overstaffed Lulls and Understaffed Rushes
The failure mode is dual, and most ops teams live it weekly. Overstaff a Tuesday lunch and you torch margin on a thin-margin day. Understaff a Friday rush and you forfeit revenue, push existing staff into overtime, and watch your best people start ghosting Saturday shifts.
The second-order costs are worse. Overtime stacks up. Callouts cascade because the crew that did show up is cooked. Turnover climbs — and in industries like food service, restaurant turnover rates are nearing 70%, which means every scheduling miss feeds a hiring cycle that costs thousands per replacement.
Then there is the regulatory layer, which used to be a footnote and is now a line item. As of May 2026, one state and eleven municipalities have implemented predictive scheduling laws. Fair workweek laws require employers to provide employees with schedules in advance, usually with two weeks notice. If schedules change, they're required to provide employees with predictability pay and/or incur penalties.
Warning
Last-minute schedule changes aren't just an HR irritation anymore. In jurisdictions like NYC, Chicago, Philadelphia, Seattle, Oregon, and LA, every shift you move inside the notice window can trigger predictability pay. Multiply that across a multi-site operation and gut-feel scheduling becomes a direct compliance liability.
The U.S. Department of Labor has even clarified how those penalties interact with overtime math — some state and local scheduling laws require employers to pay a predictive scheduling penalty when the employer changes an employee's schedule without a loss in hours but without the amount of advance notice required, and these payments are made above and beyond the employee's straight time or overtime earnings for the hours actually worked. Translation: bad forecasts now have a price tag the IRS can see (U.S. Department of Labor).
Why Historical Averages and Spreadsheets Can't Keep Up
The legacy playbook is rule-of-thumb ratios and static templates. One housekeeper per 14 rooms. One server per 20 covers. One picker per 80 units per hour. These ratios are not wrong — they are just blind to everything happening outside the spreadsheet.
A static template cannot see:
- A weather front that kills walk-in traffic
- A promotion that triples online orders for a 4-hour window
- A concert two blocks away that shifts your dinner peak by 90 minutes
- A flu wave that pushes your callout rate from 4% to 11%
- A client event that doubles patient transport volume on a Tuesday
The spreadsheet is not the planner's failure. It is the bottleneck. A human staring at last quarter's averages cannot reweight twelve variables every morning before the 9 a.m. standup. A model can, and it can do it across fifty sites simultaneously.
This is the shift: from reactive, past-focused models to systems that ingest live signals and re-forecast continuously. AI models typically reduce forecasting error by 20-30% compared to traditional methods, and more aggressive implementations have shown forecast error reductions of 30-50% compared to traditional methods.

What Predictive Labor Forecasting Actually Does
Strip the marketing language and the mechanics are straightforward. A predictive labor forecasting system does three things in a loop.
- Ingests demand signals. Historical shift data, POS transactions, foot traffic, weather, local event calendars, promotions, patient census, occupancy, ticket sales — whatever drives volume in your vertical.
- Generates a demand curve. Usually at hourly or 15-minute granularity, broken out by role, location, and shift block. Intra-day demand prediction at 15-minute granularity means schedules can commit two weeks ahead with much higher accuracy, reducing the need for changes and the resulting premiums.
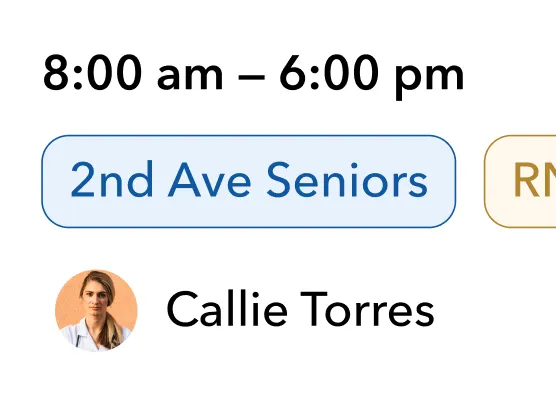
- Translates the curve into required headcount. Then auto-builds a schedule that respects credentials, overtime thresholds, union rules, and fair workweek notice periods.
The quiet part is the feedback loop. Machine learning models are advanced algorithms that continuously improve forecasting accuracy by learning from outcomes and adjusting predictions. Every shift that runs becomes training data. The model that was 78% accurate in month one is 91% accurate in month six — if your data is clean.
The retraining loop in practice
- Monday's forecast says you need 14 housekeepers for a 220-room hotel running 84% occupancy.
- You schedule 14. Two call out. One stays late.
- The system logs the variance, the callout pattern (Mondays, specific worker, post-weekend), and the actual productivity per room.
- Next Monday's forecast adjusts. The callout-prone worker gets routed off back-to-back Sunday/Monday pairs. The headcount target nudges to 15 when occupancy crosses 82%.
That is the loop. It is not magic. It is just disciplined measurement that no human ops manager has time to do by hand.
The Data Inputs That Make or Break Your Forecast
A forecast is only as good as the signals feeding it. Most failed deployments fail here, not at the algorithm.
| Signal | Why it matters | Common failure mode |
|---|---|---|
| Historical shift data (2+ years) | Establishes seasonality and baseline | Stored in legacy WFM with no API |
| Time-and-attendance records | True worked hours vs. scheduled | Clocks not tied to schedule IDs |
| No-show rates by worker and site | Calibrates buffer headcount | Tracked in a manager's head, not a system |
| Credential expirations | Determines who is actually eligible | Spreadsheet that no one updates |
| Weather and local events | Demand shifters | Not integrated; manually overridden |
| Client-specific drivers | Patient census, occupancy, ticket sales | Lives in client systems with no feed |
The data-quality trap is real. Fragmented systems and dirty historicals produce forecasts that are worse than a seasoned manager's intuition. If your no-show data is wrong by 15%, the model will under-buffer every shift and you will spend the savings on emergency callouts.
Important
A unified workforce data layer is the prerequisite, not the nice-to-have. If scheduling, time tracking, credentials, and pay live in four different systems, your forecast is guessing. The Teambridge Platform was built specifically to consolidate those signals into one operational substrate so the AI has something clean to learn from.
From Forecast to Filled Shift: Closing the Loop on Coverage
A forecast that sits in a dashboard is a report. A forecast that drives action is an operation. The difference is execution plumbing.
Here is what closing the loop looks like in a mature deployment:
- Auto-generated shift plans. The model produces a draft schedule that respects credentials, OT thresholds, union rules, and fair workweek notice. Managers review and adjust, they don't build from scratch.
- Intraday re-forecasting. Someone calls out at 6 a.m. The system re-runs the demand curve against the new available headcount and flags whether you actually need a replacement — or whether the day's demand is soft enough to absorb the gap.
- Targeted callouts to qualified nearby workers. If you do need coverage, the system pings the smallest qualified pool first — credentialed, available, under OT threshold, geographically close. Not a blast to 400 people.
- Compliance checking on every change. The WFM agent reviews each scheduled shift against the jurisdiction's current rules and flags violations before they happen. The compliance engineering becomes continuous rather than a quarterly audit.
This is where forecasting earns its keep. Teambridge Scheduling handles the auto-fill and credential enforcement; the AI Platform runs the intraday re-forecast and the targeted outreach. The forecast is upstream. The execution is downstream. Both have to work.
What Operators Should Measure: Forecast Accuracy, Labor Variance, Coverage Rate
If you can't measure it, you can't improve it, and you definitely can't defend the budget for it. Here are the KPIs that actually prove a forecasting program is working.
- MAPE (Mean Absolute Percentage Error). Mean absolute percentage error (MAPE), root mean square error (RMSE), and other statistical measures quantify prediction accuracy. Top deployments push MAPE into the 5-10% range. Anything above 20% means the model is barely beating a coin flip.
- Labor variance vs. plan. Actual labor hours minus forecasted hours, by shift. Persistent positive variance means you're padding. Persistent negative variance means you're under-covering.
- Coverage rate. Percent of forecasted demand actually staffed. 95%+ is the target on shifts that matter.
- Overtime hours as % of total. Should trend down as the forecast tightens.
- Last-minute schedule change penalties. Direct dollar exposure under fair workweek rules. Track it as its own line item.
- No-show recovery time. Minutes from callout to filled shift. If this is still measured in hours, your execution layer is broken.
Realistic benchmarks: many businesses report 3-5% decreases in overall labor expenses within the first year of implementation, primarily through elimination of unnecessary overtime and reduction of overstaffing during slower periods, and companies implementing comprehensive labor forecasting solutions report significant return on investment, with many achieving 5-15% reductions in labor costs while simultaneously improving service metrics.
Note
Beware vanity dashboards. A pretty chart showing "forecast accuracy: 94%" means nothing if the schedule it produced still got overridden by managers and the final labor variance was 18%. Measure the schedule that actually shipped, not the one the model proposed.
Industry Realities: Staffing Agencies, Healthcare, Events, and Hotels
The math is the same. The demand signals are not. A forecast that works for a hotel will be useless for a stadium without retraining on different inputs.
Staffing agencies
The demand signal is fill-rate against client orders. The model has to forecast not just how many workers a client will need next week, but which workers will actually show up, which credentials will still be valid, and which clients are likely to expand or pull back orders. Margin lives in matching the right worker to the right shift before a competitor agency does. See Staffing Agencies for vertical-specific workflows.
Healthcare
Acuity-based census prediction is the unlock. Predictive models help anticipate changes in patient volume, acuity and service demand, allowing clinical leaders to deploy staff more effectively, maintain safe nurse-to-patient ratios and reduce the risk of quality issues associated with understaffing. The cost of getting it wrong is not just margin — it is patient safety and regulatory exposure (Becker's Hospital Review).
Live events
Demand is driven by ticket sales, gate times, weather, and the artist or matchup. Peak crews scale 4-6x baseline for a few hours, then collapse. The forecast has to predict not just headcount but timing — when to call people in, when to release them. See Live Events & Venues.
Hotels
Housekeeping matches occupancy. F&B matches restaurant covers and banquet contracts. The signals are clean — occupancy is known days out — but the labor cost of getting it wrong is brutal on a 60% occupancy night when you scheduled for 80%. See Hotels & Hospitality.
Where to Start: A Practical Rollout for Operations Leaders
No one rolls out predictive forecasting across fifty sites on day one and survives. Here is the path that works.
- Audit your data sources. Before any model, map where historical shifts, time-and-attendance, callouts, credentials, and demand drivers actually live. If half of it is in spreadsheets, fix that first.
- Pick one site or one client to pilot. Ideally one with enough volume to generate signal and a manager who will actually engage with the output.
- Define accuracy and variance targets up front. MAPE under 15%, labor variance under 5%, coverage rate above 95%. Write them down.
- Run AI forecasts in parallel with the current process for 4-6 weeks. Don't cut over. Compare the AI's recommended schedule against what the manager built. Track which one would have produced better outcomes.
- Cut over, then expand. Once the pilot site clears the targets, roll to the next cluster. Retrain models on the new site's data — don't assume the pilot model generalizes.
- Instrument the KPIs and review weekly. Forecast accuracy, labor variance, coverage rate, OT, penalties. If the numbers slip, the model is drifting or the data feeds broke.
The operators who win at this are not the ones with the fanciest algorithm. They are the ones with clean data, clear KPIs, and an execution layer that turns the forecast into a filled shift before the gap becomes a problem.
Gut-feel scheduling had a long run. It is not coming back. The next decade of operations belongs to teams that can see the demand curve before it hits and have the system in place to staff against it. If you want to see what a forecasting and execution stack actually looks like in production, start with the Teambridge Platform.